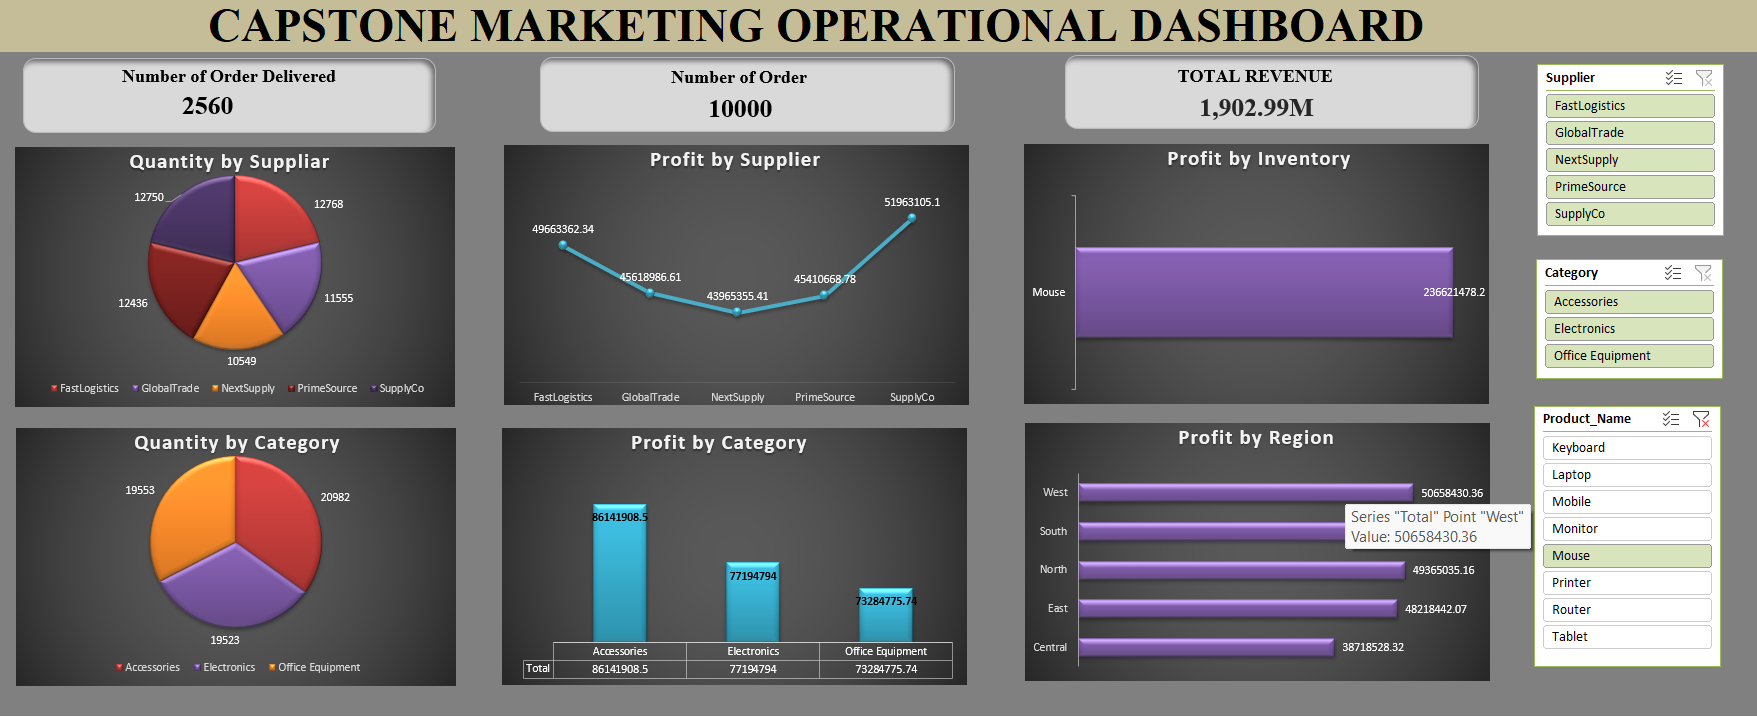
This project focuses on comprehensive analysis of sales and operational data to generate actionable business insights. The primary objective is to transform raw datasets into meaningful information that supports strategic decision-making, improves operational efficiency, and enhances profitability.
Using Advanced Excel techniques, the project evaluates key performance indicators (KPIs), identifies trends, and highlights opportunities for business growth. The dashboard provides an interactive and visual representation of complex data, enabling quick and effective analysis.
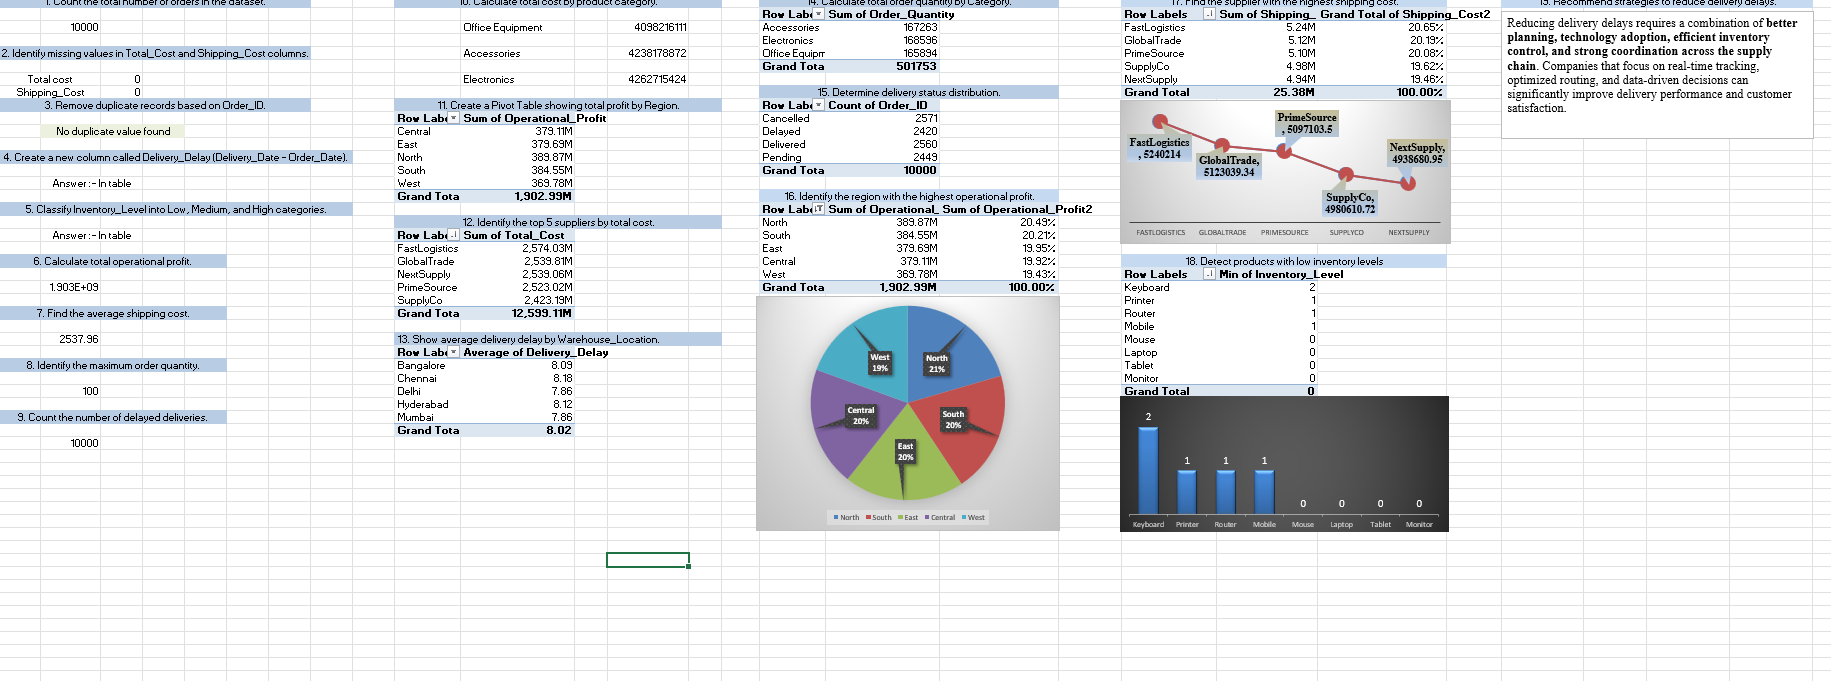
- Perform data cleaning and transformation for accurate analysis
- Analyze sales performance across different regions and time periods
- Identify high-performing and low-performing products
- Evaluate key business metrics such as revenue, profit, and order volume
- Optimize inventory management using demand insights
- Develop interactive dashboards for real-time decision-making
- Pivot Tables & Pivot Charts
- VLOOKUP / HLOOKUP
- Conditional Formatting
- Data Cleaning & Preprocessing
- Data Transformation
- Dashboard Design & Visualization
- Monthly and yearly revenue trend analysis
- Identification of peak sales periods
- Comparative performance tracking
- Region-wise revenue contribution
- Identification of high-growth and low-performing regions
- Product-wise profitability evaluation
- Identification of top-selling and low-performing products
- Demand vs supply gap identification
- Stock level optimization insights
- Order distribution and volume tracking
- Customer demand pattern analysis
- Certain products consistently underperformed, impacting overall profitability
- A few regions contributed significantly to total revenue, indicating growth opportunities
- Inventory imbalance was observed in specific product categories
- Sales trends revealed seasonal demand patterns
- Data-driven recommendations were provided to improve business efficiency
- Enabled data-driven decision-making for management
- Improved visibility of key business metrics (Revenue, Profit, Orders)
- Identified opportunities to increase profitability
- Supported better inventory planning and resource allocation
- Enhanced reporting efficiency through interactive dashboards
- 📁 Dataset (Raw Data)
- 📊 Excel Dashboard File
- 📈 Analysis Sheets
- 📷 Dashboard Screenshots
- Integration with Power BI for advanced visualization
- Automation using Excel VBA / Macros
- Implementation of predictive analytics using Python
- Real-time data integration for dynamic dashboards
Shubham Chandan Sahu MBA (Pharmaceutical Management) | Data Analysis Enthusiast
📍 Narla, Kalahandi, Odisha, India
🔗 LinkedIn: https://linkedin.com/in/subhamchandansahu02 🔗 GitHub: https://github.com/subhamchandansahu-png